2016/07/06

Common Misconceptions When Buying Solar


Reference: BY DAMAN COLE APRIL 27, 2016 IN MARKETS, TECHNOLOGY
Yingli Blog

As one of the fastest growing industries, there are many opinions and marketing taglines used which ultimately result in many misunderstandings.

Below are contradictions that you may have come across before:

1. All solar panels look similar, are they the same?
With over 500 brands that have been sold within the Australian market (between 2011-2015), it’s difficult for even an experienced professional to tell the difference. Accepting the idea that the label or datasheet has typical information as below – doesn’t mean they’re all the same:


  • 10 year product warranty
  • 25 year performance warranty
  • Power class rating (eg. 250wp/260wp)

The manufacturers around the world have gained the majority of their market share through their ability to manufacture high standard products, which demonstrates a high level of research & development including exposure to different types of environment and life cycle tests. These are seldom regarded as important in the eyes of many retailers and consumers.

The best way to determine global exposure is asking for project references in other countries. Chances are if evidence can be provided that the products are used in larger projects in a number of other markets – there has been enough due diligence to suggest it will work for you in your market.

2. Kilowatts & Kilowatts – (kW, kWp, kWh)
Traditionally there is much confusion on this topic for non-technical buyers. Also, it’s commonly referred in the retail spaces that you are buying a system size.

For example, solar systems in Australia are sold as “5kW systems”, but really should be sold as 5kWp.


  • The ‘p’ indicates “peak”, as in the amount of power being generated at peak production (being 1,000 w/m2 irradiance of direct sunlight).
  • Kilowatts are the measurement of energy units. When referred as kWh (kilowatt hours), it means the energy used at a constant rate over a period of time.
  • Referencing of kW or kWp does not indicate the yield or likely performance over a day, week, month or year – providing an unrealistic outcome of the solar system’s potential. It’s like saying a car that drives at 200km/h is a “200km car” – where in truth it’s only highlighting the ‘peak performance capacity’.

Once again, if larger global projects have specified and used a nominated brand of product, it is because their independent and technical due diligence suggests there is high level of confidence in a manufacturer’s ability to consistently create a product that generates a reliable quantum of electricity generation year on year.

3. What does “Tier 1” mean?
The solar industry has struggled for years with a methodology to rank and assess the relative strengths of PV manufacturers. In the absence of a true quantifiable testing regime, many have resorted to the views of financial analysts. In many instances, the industry use this term as a mean of quantifying quality, without placed onus on any specifics.

The tier system is a ranking structure used by varying financial analysts and firms. The most commonly accepted definition is based on “bankability”, which ultimately is a determination based on whether projects using the solar products are likely to be offered non-recourse debt financing by banks.

Other definitions and interpretations of ‘tier-ranking’ have included theories around vertical integration of product, presence of a local office and support, all of which indirectly suggests a level of product quality or after-sales support.

Tier-ranking can be highly subjective without substance of what it actually defines.


YGE Global - Photos - R&D, Lab, Testing - 01

4. Does the country of origin affect quality of a solar panel? German made or German engineered, is it better than all others?
The reference of a product’s country of origin is an age old method of oversimplifying quality, by providing an emotive feel good to buyers – which supersedes the requirement for further due diligence.

Solar PV has been one of the most rapidly expanding industries within a manufacturing sector for years, however with this rise, it has seen significant players trip, if not fall through this massive growth phase. Many manufacturers prefer to diversify their base and expand by opening many plants around the world. It simply isn’t fair to assume a quality of engineering or product based on the location of where product is assembled or where the headquarters of the business is operating.

It’s deceptive and misleading to suggest the quality of a product can be determined solely from its country of origin, especially if the suggestion is that a product made in Asia is created to a lesser standard, when compared with other non-Asian markets. In 2013, it was reported that over 90% of solar panels imported to Australia were made in China, despite the popular non-Chinese brands being prevalent in the offers from retailers.

With such high level of market penetration from solar PV brands from China, the quality gap is broad, making the importance of differentiating quality is why some manufacturers stay in business and others don’t.

5. Doesn’t all solar PV manufacturers provide the same warranty protection?
Australia is one of the world’s most dynamic retail residential markets, and with a flood of messages in the industry, it has been easy to think that if a solar panel offers a 25 years (performance) warranty, then you will be protected?

This is true, but only to an extent.

The 25 years warranty is a performance warranty pertaining to minimum expected performance or output year on year. This is separate to the performance of the system as a whole, which is subject to the system design and performance of other components.

Although many customers are sold on the belief that there would never be a fault, this is largely misleading and for the following reasons:


  • The technologies are well proven, so are installation done by people, and human error is always an unquantifiable risk.
  • Transportation risk can affect a product, it’s unlikely that defects from transportation show.
  • The technology is exposed to the outdoor environment, which is subject to wind, rain, dust, dirt and bird droppings, trees, twigs, possums – just to name a few.

So, do buyers ask – what is the process in the unlikely event of fault or failure?


  • How do I know?
  • Is the system being monitored? Is the monitoring only for the homeowners viewing, or is there a back to base system which communicates to you, the owner and also the installer?
  • What happens if you don’t know or can’t find the installer?
  • Who supports the installer?
  • What are your consumer rights?
  • Do the major component suppliers have a local representative? If so, who are they and what is their phone number?

Performance warranties are valid if there is adequate evidence to suggest your performance is less than designed. Regardless, an assessment will need to be done, preferably by the company or installer who sold you the system. If they cannot be found, then buy from a reputable and industry-qualified professional.

6. It’s all about price!
It’s a common reality in buying anything, when in doubt, select the best value for money. This suggests that value has been presented, on the contrary, the lowest cost solar is no exception. In many instances, the lowest cost components generally require a higher level of repair and replacement – the consumer may not be aware of this, and it will cost them more in the long run.

With any capital investment, you want certainty in the unlikely event of any fault or failure, above and beyond long-term guarantees.

It is strongly encouraged that you conduct research about some technical differences, and have a list of questions about how you will receive after-sales support and service. The reality is if you don’t understand the differences, the only value you can see is one based only on the price.

7. Capabilities of product and installer
With such an expansive list of products and installers – it can be difficult to know the good from the not so good. The buying market has no point of reference to determine if a solar panel or inverter is good versus average – as it is based on Clean Energy Council’s approval.

Aside from generic references, which are meant to instill confidence, like “we have installed over 3,000 systems”, there is no means for buyers to understand the experience or quality of services they are paying for.

One of the biggest concerns is whether the installer is based locally, and we suggest you to ask these questions:


  • If the installer does not have a local office, have you enquired their service standards and response times in the unlikely event of a fault?
  • What is the policy and commitment of the after-sales service?
  • What is their responses time frame?
  • Is there a difference in receiving service within 48 hours or over 4 – 8 months?

There are many fantastic and integrated installers in the market but unless a series of questions are being asked, how will a solar buyer know? The age-old method of testing this is to ask for references, preferably from people in similar situations as you, and a customer who had bought from them previously.

We encourage those interested in solar to do their research, the team at Yingli Solar are available to help answer any products, services or technical questions you may have!

We in the Philippines can help you to install Yingli Solar for your energy needs. Please send your email to inquiry@eastgreenfields.com or call/text 0917-8232530.


2016/06/09

Can renewables only power the Philippines and emerging Asian markets?

There is a belief that “renewables only” can supply all the power and electricity needs of the Philippines, or of the world. Because the sun shines everywhere, the wind can blow everywhere, there is biomass everywhere, there are rivers in many places and some countries are “blessed” with plenty of volcanoes and geothermal power is more available to them. Therefore, it is just a matter of “political will” to make this “renewables alone” to happen nationwide or worldwide.

This urban legend has spread and persisted for many years until today. Never mind that while there is indeed high contribution to electricity production by hydro in many countries, and geothermal for the Philippines and the US, the rest of renewables -- solar, wind, biomass, tidal power -- have contributed very little.

In 2015, of total electricity production in the Philippines, only 1% came from solar + wind + biomass combined. Their combined installed capacity has indeed expanded to around 3%-4% of total but their actual electricity generation was only 1% of total.

The “Asia Clean Energy Forum 2016,” which will be held from June 6-10 at the Asian Development Bank (ADB) headquarters in Ortigas, involve deep dive workshops and technical seminars on the first two days, and various policy discussions on the third and the fifth day.

Day 1 topics include among others, wind deployment in developing countries, green energy finance, carbon capture and storage, mini-grid lessons, Nordic models in renewables. Day 2 topics include integrating renewable energy (RE) into power systems, RE finance and PPP, powering Asian tigers with RE, and microgrid energy storage.

Then a renewables lobbyist and think tank, Center for Renewable Energy Strategies (CREST) produced a new paper, “The Energy Road Not Taken: How the Philippine Energy Plan can lead to a coal-free future within a few years.”

CREST paper cited some basic facts from the Department of Energy like baseline supply for 2016 is 16,244 MW (16.24 GW). The Philippine Energy Plan “business as usual” power demand of 10.9 GW in 2012 to rise to 23.2 GW in 2030. But with the introduction of the Philippine Energy Efficiency Project, the projected demand will be lower, only 19.56 GW by 2030 and the required supply will only be 21.63 GW by 2030.

Including regulating reserves, the projected derated additional power requirements will be 7.73 GW by 2030. CREST says this can be supplied by RE only -- but mostly hydro and geothermal, plus some wind power.

Is this scenario of “renewables only” for those 7.7 GW of power by 2030 possible for the Philippines?

Two tables below will help answer this question. Table 1 will compare energy density of various sources of electricity. Some definitions to better understand this table.

(1) Energy density -- the amount of energy stored in a given system or region of space per unit volume.

(2) Specific energy -- the amount of energy stored per unit mass (weight).

(3) 1 joule -- can produce one watt of power for one second, or one “watt second” (W·s).

(4) 1 kWh = 3.6 megajoules (MJ); or 1 MJ = 0.28 kWh

While diesel, gasoline, and coal can produce megajoules of power per liter, renewables like wind and solar can produce only a few joules, or fraction of joules, per cubic meter of space. Low energy density means low capacity to produce electricity per unit or volume of energy source.

The next table on levelized cost of electricity (LCOE) will corroborate the above statement. LCOE is a good measurement of the overall competiveness of different power generation technologies over an assumed financial life and duty cycle.

Capacity factor means the ratio of actual electricity output over rated or installed capacity (see Table 2).


So with (a) low capacity factor, (b) high capital cost, (c) high fixed operation and management (O&M) cost, and (d) high transmission cost, even if the cost of fuel (variable O&M) is zero, the renewables’ competitiveness is heavily reduced and compromised.

Note that latest and more advanced technologies in wind and solar from an advanced economy (US) are assumed to be employed here because these are power plants that are expected to become operational by 2020 or four years from now.

With those numbers on the comparative technologies of various energy sources, the answer to the statement “renewables only” can power the Philippines (or the world) by 2030 and beyond is a clear NO.

Malaysia with just 31 million people (less than 1/3 that of the Philippines) has electrical capacity of 32 GW in 2014 or 2x that of the Philippines for the same period, and is projected to double it to 64 GW by 2030, up to 85 GW by 2040, the bulk of which will be from coal and natural gas (source: SEA Energy Outlook 2015). But CREST and other campaigners of “limit energy demand unless coming from our renewables” would be happy to see a 21 GW Philippine capacity by 2030, or only 1/3 that of Malaysia’s then.

The Philippines still suffers from energy poverty with very low kWh per capita consumption per year compared to many of its ASEAN neighbors. The renewables lobby will not be able to produce convincing data and arguments that intermittent, weather-dependent, and subsidies-hungry renewables will be able to get out of their inherent weaknesses.

Governments including multilateral institutions like the World Bank and ADB should spare the people of the tyranny of expensive and unstable electricity. Climate alarmism as the main alibi for renewables favoritism and cronyism should confront the fact that climate change is natural and cyclical. That global warming and global cooling cycles did happen and will continue to happen even if we go back to the stone age lifestyle.

Bienvenido S. Oplas, Jr. is the President of Minimal Government Thinkers, and a Fellow of SEANET and Stratbase-ADRi.

***

For residential/commercial roof top projects please email us: inquiry@eastgreenfields.com or visit our website: www.eastgreenfields.com

2016/05/25

PV Generation System sizing

Selecting Appropriate PV Array String Sizes
By: Kent Osterberg
Reference: HP online magazine

To appropriately size a PV array to an inverter, it is necessary to make sure that the:

•           PV array never generates more voltage than the inverter’s maximum allowed input               voltage
•           Voltage remains within the inverter’s maximum power-point tracking range
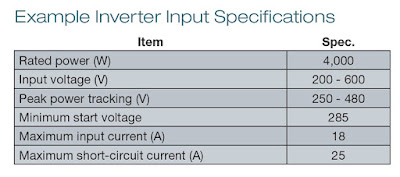
•           Current is within the inverter’s maximum current and short-circuit current                                specifications
•           Power rating is appropriate for the inverter.

Equipment Specifications

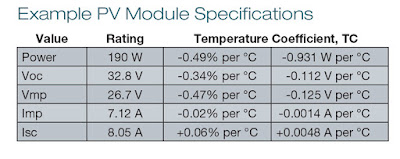
Module specs can be found on the manufacturer’s data sheet or on the back of the module. The values shown in the table are for a 54-cell module. The manufacturer includes a temperature coefficient for the peak power voltage. If the temperature coefficient for peak power voltage is not published, then the temperature coefficient for peak power, in percent, may be used as an approximation. Similarly, inverter specs may be found on the inverter data sheet or its label.

Temperature Data

Because a PV module’s output depends on its temperature, calculations also must account for the lowest and highest possible site temperatures. One source for record temperatures is weather.com; another is SolarABCs.org, which has an interactive ASHRAE data map. A table of ASHRAE temperature data can also be found in “Expedited Permit Process for PV Systems” at SolarABCs.

For the first computation, which low temperature should you use—the ASHRAE tables’ “extreme minimum” or the record minimum from the local weather station? The “extreme minimum” is a little misleading—half of all years will have at least one day that is colder than this temperature. The “extreme minimum” is actually the average annual minimum temperature. Since inverters should never see a voltage that exceeds the maximum input voltage, I choose to use the more conservative method—the record low temperature. If you use the “extreme minimum” temperature, you may get one extra module in the string, but on some cold winter day, that extra module may result in damage to the inverter or void its warranty.

Calculate the Maximum Number of Modules in Series

The equation to solve for the maximum number of modules in series is:


Using example data from the table:


Since we have to work with whole modules, 15 modules is the maximum that can be wired in series.

Calculate the Minimum Number of Modules in Series

There are two factors to consider—PV module output degradation over time, and the effects of high temperature. Most studies of PV module degradation focus on power, concluding a median value for module power degradation of about 0.5% per year. Recently, the National Renewable Energy Laboratory (NREL) studied 12 mono- and poly-crystalline PV modules to see how the current and voltage parameters change over time. Relative to determining inverter string size, the significant finding was that 10 out of 12 modules showed less than 0.2% per year degradation in Vmp, with Voc remaining essentially unchanged. Since we’re estimating a PV module lifespan of more than 25 years, we need to consider that Vmp may drop by 5% over the system’s life: 0.2% per year × 25 years = 5%.

For the temperature factor, the ASHRAE “annual design dry-bulb high temp” value (either 2% or 0.4%), or the record high temperature may be used. The 2% temperature factor means only exceeding 2% of the time in the months of June, July, and August. The 0.4% temperature factor is only exceeded 0.4% of the hours during the hottest month—but there may be other months that it is exceeded. The temperature selected will determine how many hours every year the inverter may deviate from the maximum power point voltage.

Using the 2% temperature value will result in about 42 hours over the summer when the inverter may operate off its peak power point. With the 0.4% temperature, the inverter may operate off the peak power point for three hours during the hottest month of the year, and probably a similar number of hours for the other two summer months. If the record high temperature is used, the inverter should always be able to track the maximum power point. Since a small energy loss is far less critical than an inverter failure, there is no need to be conservative about which one is used. The sample documents provided in “Expedited Permit Process for PV Systems” use the 2% value. In my Oregon location, to be eligible for incentive money, I’m required to use the more conservative 0.4% temperature, which is used in the following calculation:


The minimum number of modules in series is 13 modules:


Since these modules are sitting in the sun and heating up during the day, the PV cell temperature will be hotter than the ambient air temperature and thus a temperature “adder” is used to estimate the PV module’s cell temperature. Different temperature adders are used depending on the array mounting method (see table). This example assumes a roof-mounted array, for a temperature adder of 35°C.

Find the Maximum Number of Module Strings

The maximum number of module strings in parallel is the smaller of:


No temperature corrections are used because they are extremely small for current and because the inverter will simply clip power (rather than sustain damage) if current is higher than it is rated for.

Sizing the Array

Since PV modules generally operate at lower output compared to their standard test conditions (STC) rating, inverter manufacturers commonly specify a maximum array size up to 125% of the inverter output rating. Given a 4,000 W inverter, up to 5,000 W of PV modules (4,000 × 1.25) could be installed. In this example, the maximum number of modules would be 5,000 W ÷ 190 W per module = 26.3, i.e., 26 modules.

The possible combinations that may be considered for this inverter are: one string of 13, 14, or 15 PV modules or two strings of 13 PV modules. If we go with two strings of 13, we have a final array size of 4,940 W. Note, since one string would be at most 2,850 watts, it would be appropriate to select a smaller inverter for a single string of modules. But keep in mind the calculations will have to be repeated for the smaller inverter.


***

For residential/commercial roof top projects please email us: inquiry@eastgreenfields.com or visit our website: www.eastgreenfields.com

The Solar Story Is Just Beginning

Robert Rapier 
Reference:Forbes online news (http://onforb.es/1NLawHy)

Several years ago, when I was working on my book Power Plays, I spent a lot of time thinking about the future of energy. One thing I concluded was that solar power would become one of the world’s most important sources of energy – if not eventually the most important source of energy.

There are a couple of reasons I still believe this. But first, I should make it clear that it will be a long time before solar power rivals the consumption of oil in the global energy market.

While solar power is growing rapidly, we still use about 100 times as much energy in the form of oil (and about 90 times as much in the form of coal). Further, even though solar power is growing at a fast rate, the absolute growth in oil consumption from 2013 to 2014 was about 3 times the growth in solar power consumption. In other words, even though solar consumption grew at a 38% rate and oil consumption grew at about a 0.7% rate, this amounted to an increase in solar consumption of 11.6 million metric tons of oil equivalent versus an increase in oil consumption of 32 million metric tons.

So I want to at least offer that perspective, which is often missing in articles about renewable energy sources. Still, what I would say today is that solar is the most important emerging energy source, and over the next one to two decades it will surpass coal and begin to rival oil in the amount of energy supplied globally.

I believe the key drivers behind solar’s continued growth are that the energy conversion efficiency is relatively high (~an order of magnitude greater than photosynthesis) and that the costs for solar PV have become competitive in many markets. Further, those costs continue to fall. Solar is a very attractive option for those seeking to reduce carbon dioxide emissions.

Among all major energy sources, none added capacity as rapidly as the 50% average annual growth rate of solar photovoltaics (PV) over the past five years.


Growth in solar PV over the past decade has resulted in a nearly 50-fold expansion in the amount of deployed solar PV capacity since 2004:


Of course capacity isn’t the same as production. As I pointed out in Don’t Blame Renewable Energy For Dying U.S. Coal Industry, the capacity factors for renewables like wind and solar power are low relative to their fossil fuel competitors. So an installed megawatt (MW) of solar PV capacity won’t produce the same amount of electricity over the course of a year as an installed MW of coal-fired power (for instance). In fact, it could take more than three times the installed capacity of solar to generate the amount of electricity from a given capacity of coal-fired power in a year.

This means that if solar is to make a serious dent in the world’s fossil fuel demand, we are going to be installing a lot of solar panels. Who makes these solar panels?

According to research and consulting firm GlobalData, the Top 5 solar PV manufacturers in 2015 were China’s Trina Solar with 4.55 Gigawatts (GW) of solar PV panels produced, followed by Canadian Solar (3.9 GW), Chinese companies JinkoSolar Holding Co., Ltd. (3.79 GW) and JA Solar Holdings Co., Ltd. (3.38 GW), with South Korea’s Hanwha Q CELLS Co., Ltd. (3.2 GW) round out the Top 5. While China dominates in global PV manufacturing, two U.S. producers in the Top 10 are First Solar FSLR +2.91% and SunPower.

If solar PV growth continues as I expect, the sector should do quite well overall, but SunEdison’s recent bankruptcy show that bad decisions can quickly take down large companies in rapidly growing sectors. It’s important to keep that in mind and do your due diligence before diving into this sector.

***

For residential/commercial roof top projects please email us: inquiry@eastgreenfields.com or visit our website: www.eastgreenfields.com

RENEWABLE ENERGY IS A GLOBAL SUCCESS

Last year, for the first time, according to a report in the New York Times, renewable energy sources – principally wind and sun – accounted for the majority of new electricity-generation capacity that was added around the world. More than half of the $286 billion invested in wind and solar occurred in emerging markets such as China, India, and Brazil. Ten percent of all electricity generated globally in 2015 came from renewables, which nearly doubled the amount produced by renewables in 2007.

The average global cost of generating electricity from solar panels fell 60 percent between 2009 and 2015. In such sunny countries as India and Dubai, some developers of solar farms have offered to sell electricity for half the global price. Replacing coal-fired power plants with renewables also has major health benefits in heavily polluted cities in China and India, where ground-level pollutants like soot and smog adversely affect breathing.

Here in the Philippines, the establishment of solar farms in Negros Occidental has put that province on the world map. Negros Occidental recently developed seven polar power facilities, making it the Philippines’ solar power capital, with solar generation capacity of 341 megawatts of power.

In 2015, $161 billion was invested in solar energy globally, which is more than what was invested in coal and natural gas combined. For the first time last year developing countries attracted the most investment and poorer countries, such as China and Chile, are getting the bulk of their electricity needs from giant solar parks which have been linked to their national grids. This year the United States hopes to triple its solar capacity and China and India each plan to add about 1,000 gigawatts of solar power in the next six years.

Lower costs have contributed to this expansion. The price of solar panels, most of which come from China, has fallen by 80 percent in the past five years. In Mexico electricity is being offered at $40 a megawatt hour, which is cheaper than natural gas or coal.
Developing countries will need to invest more in building transmission lines to connect the solar power being generated in sunny areas to its users. Makers of solar panels should focus not just on cutting costs but on improving the technology so that more of the sun’s energy is converted to electric power.

Reference:
Romulo, B. D. (May 5). Renewable energy is a global success. Manila Bulletin. Retrieved from http://www.mb.com.ph/renewable-energy-is-a-global-success/

***
For residential/commercial roof top projects please email us: inquiry@eastgreenfields.com or visit our website: www.eastgreenfields.com

NV VOGT EYES 200 MW SOLAR CAPACITY IN PHILIPPINES

NV VOGT EYES 200 MW SOLAR CAPACITY IN PHILIPPINES


MANILA, Philippines - German-backed solar developer nv vogt Philippines is eyeing to build 200 megawatts (MW) of solar capacity in the next three years.

Vivek Chaudhri, president of nv vogt Philippines, bared the company’s direction moving forward during the inauguration of the 7.48-MW solar farm in Bgy. Dalayap in Tarlac City last Friday.

“We started in the Philippines about four to five years back and last year, we’ve seen a dramatic [turn for us] and we aim to continue putting up solar plants in the country. We’re building 200 MW in the next two to three years,” he said.

These prospective solar farms will be located mostly in Luzon and Mindanao, where the company has already established projects and could cost around $300 million to install, Chaudhri said in an interview with The STAR.

The firm is also eyeing a solar park concept in partnership with a local government in Mindanao and this effort is being led by its president Reynaldo Casas.

Last December, nv vogt Philippines completed the five-MW first phase of its 10-MW plant in Surallah, South Cotabato. “We already have a plant in Mindanao. So we’re looking at the second phase of the same size that we have developed over there,” Chaudhri said.

In Luzon, the company has constructed the 7.48-MW Dalayap solar farm and the 8.84-MW Armenia solar plant, both in Tarlac.

The contractor for all the projects was ib vogt, the German partner of nv vogt, and the plants in Tarlac were constructed in a record time of two months.

These planned solar projects can partly replace the peak power demand of these locations, especially in Mindanao, Chaudhri said.

“In Mindanao, there’s a power shortage. In addition a lot of the peak power is delivered by diesel. Solar plants generate during the day, so they’re a good replacement for a part of this peak power. We cannot replace the entire amount (as of yet) but this is a start,” he said.

“We’re waiting for the next round of feed-in tariff to be announced. We expect new FIT rate to be slightly below P8, which we think is still sustainable,” he said.
A part of the company’s 200 MW development will target the FIT.

Rivera, D. (May 10). nv vogt eyes 200 MW solar capacity in Philippines. The Philippine Star. Retrieved from http://www.philstar.com/business/2016/05/10/1581546/nv-vogt-eyes-200-mw-solar-capacity-philippines

***
For residential/commercial roof top projects please email us: inquiry@eastgreenfields.com or visit our website: www.eastgreenfields.com

2016/03/10

Lower Meralco bill expected for March


CUSTOMERS of Manila Electric Co. (Meralco) can expect to pay less this month as the generation charge -- the biggest component of their bill -- goes down due to higher power plant dispatch.


2016/03/08

New ways of allocating solar power quotas being studied


THE DEPARTMENT of Energy (DoE) is looking at options on how it can encourage the development of more renewable energy projects after March 15 -- the deadline it set for solar plant developers to fill an installation target of 500 megawatts (MW).


http://bit.ly/1RPjjq1